


Client report
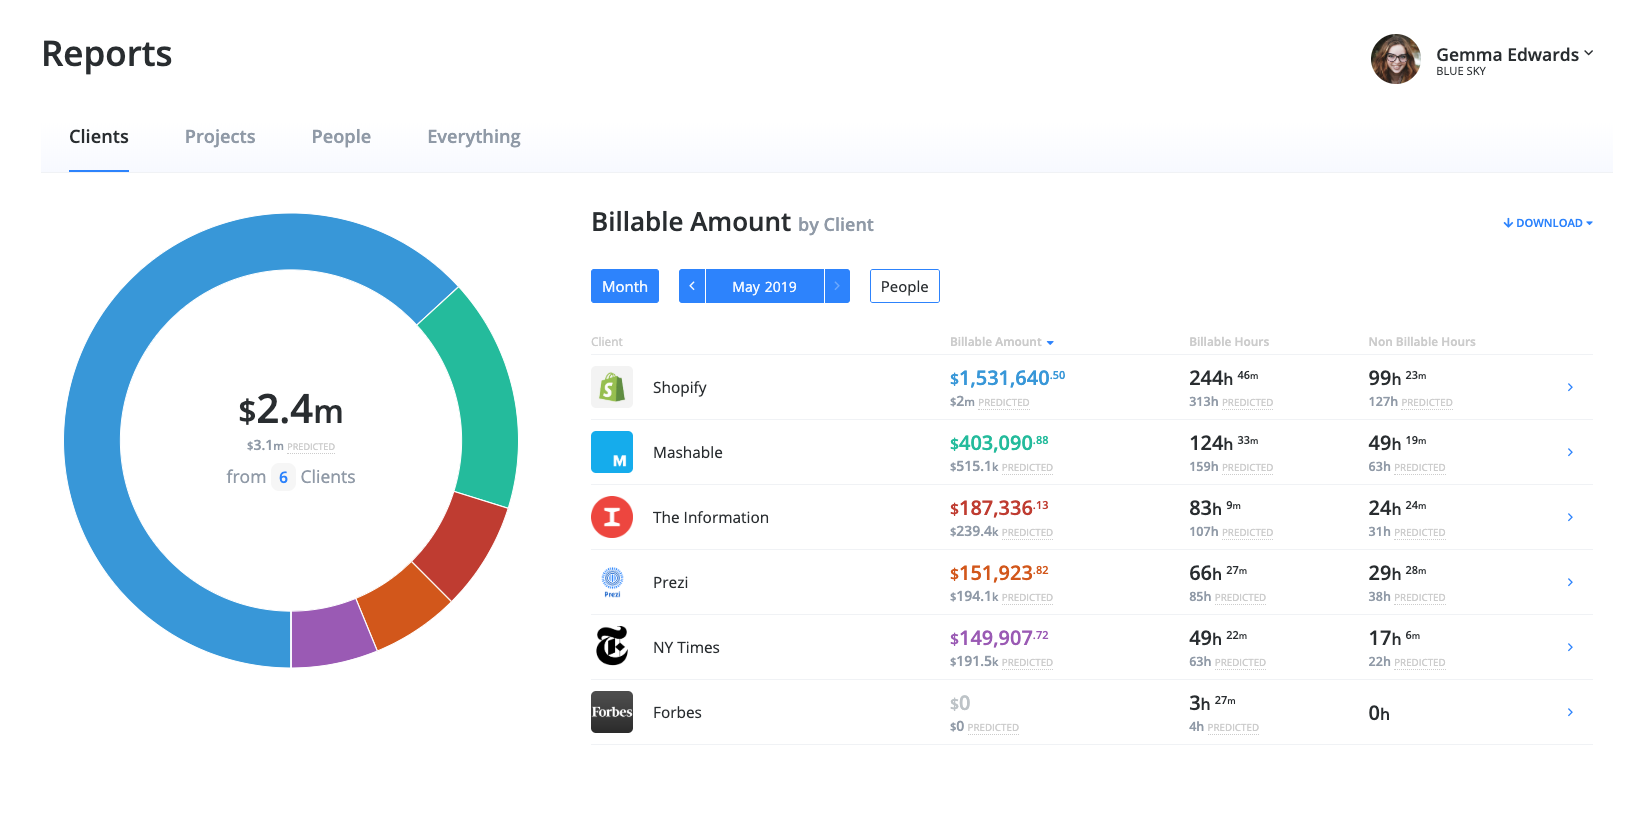
The Client report shows key metrics for work recorded by client. This information appears in the donut chart on the left and in the table on the right.
Note: Admin and Standard users see different information in this report. Admin users see all clients and billable data. Standard users only see the client data that they've logged and don't see any billable data.
Here's what the Client report looks like for an Admin user:
Donut Chart
In addition to the chart itself (the colours match those in the client list), the donut chart shows 3 pieces of information:
- Total for whichever column is selected - Billable Amount, Billable Hours, & Non-Billable Hours.
- Predicted value for the end of the current week/month/year.
- Number of clients.
Filters
The Client report supports filtering on the following:
- Period (Week, Month, Year & Custom Date Range)
- Dates
- Projects
Client List
- Client - Each client ordered by the column selected - Billable Amount, Billable Hours or Non-Billable Hours.
- Billable Amount - The total amount of billables recorded against respective clients. The value appears in the same colour as used in the donut chart. You can customise this colour on the Edit Client dialog (it's called 'reporting colour'). Hourly also shows you its prediction for this amount at the end of the current week/month/year.
- Billable Hours - The total billable hours recorded against respective clients.
- Non-Billable Hours - The total non-billable hours recorded against respective clients.
Download
In the top right of the report screen you can download the report in either CSV or PDF.